




Connect Datadog with Resolve AI
Resolve AI connects directly to your Datadog environment to reason over that data during investigations, correlating signals across your stack to identify root cause faster than any engineer could work through dashboards alone.

What Resolve AI does with your Datadog data
Most incidents don't announce themselves clearly. Resolve AI reasons over your Datadog metrics, logs, traces, and alerts in real time, correlating them against code changes and infrastructure state to compress the gap between alert and root cause.
Alert triage and noise reduction
Resolve AI evaluates incoming Datadog alerts against current service state, recent deployments, and correlated signals to distinguish genuine issues from transient spikes, so engineers engage with context from the start.
Root cause correlation across signals
Resolve AI connects metrics, APM traces, and logs to infrastructure events, tracing failures to their origin rather than where they showed up.
Deployment impact detection
When a deploy precedes degradation in Datadog metrics, Resolve AI uses custom deployment events to answer "what changed" at the moment an alert fires.
SLO and service health monitoring
Engineers use Resolve AI to check SLO health, surface recent breaches, and understand reliability trends across services, turning routine production questions into instant answers instead of dashboard hunts.
Load test and scheduled event awareness
Resolve AI checks your Datadog dashboards for load testing activity before treating a spike as a real incident, reducing false escalations and keeping on-call engineers focused on actual problems.
Cross-stack investigation
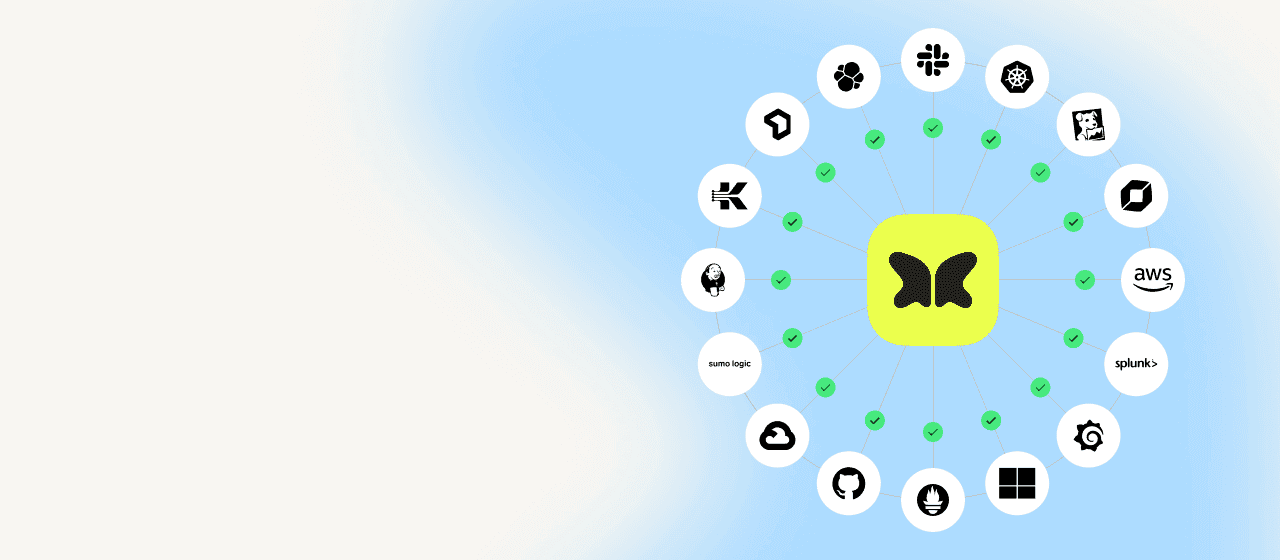
Datadog is one layer in a larger picture. Resolve AI connects your Datadog signals to Kubernetes state, code changes, and other integrated tools, so investigations span the full environment rather than stopping at the observability boundary.


Only the data that matters
Resolve AI queries your Datadog environment with the minimum scope needed to investigate, reason, and act.
Metrics
Logs
APM traces
Alerts
Dashboard data
Host tags
Resolve AI does not store raw Datadog data. Queries run during active investigations, and API credentials are stored securely within your infrastructure and never transmitted to Resolve AI's cloud.
Datadog integration capabilities
Everything Resolve AI ingests from your Datadog environment, with step-by-step docs in the setup guide.
- Read the setup guide
Metrics ingestion
Queries metrics across hosts, services, and custom namespaces to correlate performance signals with incident timelines.
- Read the setup guide
Log querying
Searches logs across indexed streams to surface error patterns and trace failures through service boundaries.
- Read the setup guide
APM trace correlation
Connects distributed traces to infrastructure events and deployment changes during active investigations.
- Read the setup guide
Alert webhook ingestion
Ingests alerts from Datadog monitors via webhook to trigger and inform real-time incident investigations.
- Read the setup guide
Custom event ingestion
When an investigation runs, Resolve AI queries your Datadog event stream for deployment and infrastructure events in the incident window, so it can pinpoint what changed right as the problem began.
- Read the setup guide
Dashboard awareness
Queries specific dashboards, such as load testing monitors, to distinguish scheduled activity from real incidents.
- Read the setup guide
Sensitive data redaction
Configurable JSON path redaction masks PII and sensitive field values before data is used in investigations.
Connect Datadog in minutes
Datadog connects via API key with read-only access. You can set up the integration through the Resolve AI UI, through the Satellite configuration, or both. Alert webhooks let Datadog monitors trigger investigations automatically.
- 01
Create your API key and App key
In Datadog, create both an API key and an App key. For each one, click + New Key, name it resolve, click Create Key, and copy the value to use in the next step.
- 02
Connect via the Resolve AI UI
Open the Datadog integration in Resolve AI, click Add Connection, and enter a name (e.g. Datadog-Main). Leave Environments blank to ingest data from all environments, or list specific ones that match your Satellite config. Paste your API key and App key, enter your site domain (e.g. datadoghq.com or datadoghq.eu), and optionally enable Sensitive Data Redaction. Turn on Service Map Enabled and click Save.
- 03
Connect via the Satellite (optional)
For teams managing configuration through the Satellite, Datadog credentials can be supplied directly in the Satellite configuration file. See the setup guide for the full reference.
- 04
Set up alert webhooks
To route Datadog monitor alerts to Resolve AI automatically, open the Datadog integration in Resolve AI and click Edit. Under Webhooks, click + to create a new token, name it Monitors, and save. Then open the Datadog Webhooks Integration in a second tab, click + New, and copy the fields from the Resolve AI configuration page. Finally, open each Datadog monitor, click Edit, and add @webhook-resolveai to the notifications field. For teams managing monitors with Terraform, add @webhook-resolveai to each monitor's Message field instead.
Frequently asked questions
Datadog is the industry standard for cloud-scale observability, unifying metrics, logs, traces, and alerts across infrastructure, applications, and security in a single platform.
Resolve AI requires a Datadog API key and Application key with read-only access to metrics, logs, APM traces, monitors, events, dashboards, SLOs, and more. No write permissions are required. The specific scopes depend on which Datadog products you use. Full details and a permissions reference are in the setup guide.
No. Resolve AI queries your Datadog environment during active investigations and does not retain raw metrics, logs, or traces. Credentials are stored securely and never transmitted to Resolve AI's cloud.
Yes. Each Datadog connection holds a single site and its own API key + App key, so you connect additional accounts or sites by adding a separate connection for each. In the Resolve UI, click Add Connection again and give it a distinct name (e.g. Datadog-EU), its own keys, and its site domain ([redacted], datadoghq.eu, [redacted], etc.). On the Satellite, add another integration [redacted] under integrations: with its own secretName and [redacted]. If different accounts represent different environments, use the connection's environment mapping to tag each one to the right Resolve environment.
Yes. The Datadog integration connects via API key and does not require the Resolve Satellite. The Satellite is needed for on-premises observability tools and for Kubernetes cluster monitoring.
Resolve AI works with Infrastructure Monitoring, APM, Log Management, Monitors and Alerts, dashboards, SLOs, and custom event streams. Support for additional Datadog products is added regularly.
Resolve AI evaluates each incoming alert against correlated signals before surfacing it to engineers, filtering transient spikes and auto-resolved conditions so on-call teams engage only with issues that require attention.
Works even better together
Datadog investigations go further when Resolve AI connects your full stack.