Loading the page…

Machines on-call for humans
Machines on-call for humans

Vibe debugging means describing a software problem to an AI agent and letting it investigate. How the loop works, where it breaks, and what production demands.
A test is failing in code you didn't write because an agent wrote it last week. You paste the stack trace into the same agent, type "fix it. Make no mistakes," and skim the diff that comes back. Accept. Green. You never opened a debugger, and you can't quite say what was wrong. Congratulations, you're now an expert in vibe debugging.
Vibe debugging is the practice of working through software problems by describing them to an AI agent in plain language and letting it investigate, diagnose, and propose or apply a fix. Fixing bugs is the obvious case, but the same pattern covers analysis and discovery questions: why is this endpoint slow, what changed last week, where does this value get set. Instead of stepping through code, infra, telemetry, and tribal knowledge yourself, you tell the agent what you're seeing and what you expected, and it goes looking for the evidence.
Vibe debugging is the natural corollary of vibe coding. In February 2025, Andrej Karpathy posted that he'd started building software where you "fully give in to the vibes": accepting every change the LLM suggests, skipping the diffs, and pasting errors back until things work. Generative AI has made natural language a workable interface for writing software, and vibe coding became the name for AI-assisted development taken to its logical extreme.
Vibe debugging followed without a single identifiable coiner. It names what happens next. Once AI coding assistants write most of the code, someone has to fix bugs in a codebase no human fully authored, and the natural move is to debug the same way the code was written: describe the symptom, iterate on the answer.
Karpathy later drew a line that helps clarify the term. At Sequoia's AI Ascent in 2026, he described vibe coding as something that "raises the floor" of who can build software, while agentic engineering is the discipline that preserves the quality bar of professional work. Vibe debugging sits on that same spectrum. At one end, it means prompting until the error goes away. At the other, it means agent-assisted root cause analysis backed by real evidence.
Vibe debugging extends vibe coding into the rest of the engineering loop. Together they make up the complete picture of engineering with vibes: one creates the software, the other explains and repairs it.
The debugging half covers two converging areas. One is fixing bugs in AI-generated code by iterating conversationally with an LLM. The other is letting AI agents investigate production systems using natural-language symptoms, correlating logs, metrics, traces, and code to identify the root cause. In both cases, whether it works depends less on the model and more on the discipline around it: evidence, verification, and permissions.
A vibe debugging session runs on a loop, and the loop starts with a trigger. Sometimes the trigger is system-driven: a failing test, an exception in the logs, an alert. Sometimes it's human-driven: an engineer's hunch that something is off, or a question they want answered. Either way, you hand the agent the trigger plus what you expected to happen.
From there, the agent forms a hypothesis, or adopts yours, and gathers evidence in multiple hops: read the failing test, trace the call path, check the recent change, run an experiment. Each hop either supports the hypothesis or kills it, and the agent adjusts. You're not idle while this happens. Between hops you can confirm the direction, redirect it, or supply something the agent can't see on its own. That steering is where the vibes actually live.
The loop repeats until the cause is validated or the question answered. Only then comes the fix: minimal, applied, and checked against the original trigger.
Claude Code documents this loop as three phases: gather context, take action, verify results. GitHub Copilot and Replit push plan-first workflows, where the agent lists likely causes and the evidence it wants before touching any files. Cursor and Windsurf add rule files, sandboxed execution, and MCP integrations, enabling the agent to query systems around the code, not just the code itself.
A few mechanisms carry most of the weight:
Session quality mostly tracks the quality of the problem statement, and web development shows this clearly: a browser regression can be reproduced, screenshotted, and inspected in DevTools, which hands the agent runtime evidence instead of vibes.
The starting point moves from instrumentation to description. Traditional debugging begins with a stack trace and a debugger. Vibe debugging begins with a sentence.
| Traditional debugging | Vibe debugging | |
|---|---|---|
| Starting point | Stack traces, debugger sessions, breakpoints | A natural-language description of the symptom |
| Who drives | The engineer steps through the code | An AI agent investigates, the engineer steers |
| Evidence | Gathered manually through instrumentation | Gathered by the agent through tool use, context, and memory |
| Verification | Rerun and confirm by hand | Tests, builds, or browser checks the agent runs itself |
| Typical failure | Slow, especially in unfamiliar code | A confident fix for the wrong cause |
The two combine well in practice. Breakpoints, network inspection, and browser stepping are still high-leverage ways to produce runtime evidence, and agent tooling increasingly sets them itself rather than working around them. What changes is who decides where to look, and how fast the loop runs.
The main risk is coherence without correctness. Without a robust agent architecture behind it, an LLM can give an answer that reads like a diagnosis but was never tested against the system: an explanation that sounds right, patches the symptom, and leaves the underlying cause in place. The test goes green, the session ends, and the bug comes back wearing a different error message.
The second risk is security. Veracode's 2025 GenAI Code Security Report tested more than 100 LLMs across 80 coding tasks and found that 45% of generated code samples introduced security flaws. Its spring 2026 update shows the gap widening: syntax correctness now exceeds 95%, while security pass rates remain flat at around 55%. A debugging agent that writes code inherits those odds, and a fix merged under incident pressure usually gets less code review than a feature.
That risk is already visible in deployed software. Escape scanned more than 5,600 publicly available vibe-coded apps and found over 2,000 high-impact vulnerabilities, 400+ exposed secrets, and 175 instances of exposed personal data. Security gaps like these rarely surface during a debugging session because the app works. Nothing about "it works now" tells you what else the fix left open.
There's also review debt. When AI coding assistants write and debug faster than humans can review, latent bugs accumulate behind the facade of productivity.
Treat it as a constrained engineering loop rather than an improvised chat. The practices that separate the two:
One more habit worth building: notice when the bug is really a maintainability problem. Plenty of defects in AI-generated code trace back to structure rather than logic, so some sessions should end in refactoring, not a patch.
The same symptom-first habit is moving from the editor into production, and the naive version travels with it.
Picture the 2 am page: P99 latency on the checkout service has doubled. The on-call engineer does the natural thing. They take a screenshot of the dashboard, copy 200 log lines, paste them into a chat window, and ask what's wrong. The answer comes back in seconds: likely connection pool exhaustion, so try raising the pool size. It sounds plausible, and it arrives with real confidence.
But the model only saw what got pasted. It couldn't pull a trace to find which hop degraded, didn't know a deploy went out at 1:47, and had no way to test its own hypothesis. The engineer bumps the pool size, latency drifts down as overnight traffic ebbs, and everyone goes back to bed. The retry loop that shipped in that deploy is still there, waiting for the morning peak.
That's vibe debugging at its riskiest: partial context, an unverifiable hypothesis, and a production change made on the strength of a well-worded guess.
The natural-language front door is identical in both versions. The difference is what the answer is made of: a chat window reasons over whatever you pasted, while a connected agent reasons over what it went and found, then verified. Same alert, different machinery.
An agent connected to the production environment starts from the same symptom, but it investigates instead of pattern-matching on pasted text. It pulls traces and sees the latency concentrated in calls to a downstream payments service. It checks recent changes, finds the 1:47 deploy, diffs it, and spots new retry behavior that multiplies request volume under load.
It confirms the picture against the downstream service's own metrics, then hands the engineer a diagnosis with the evidence attached: the trace, the diff, the graph, and the hypotheses it ruled out along the way.
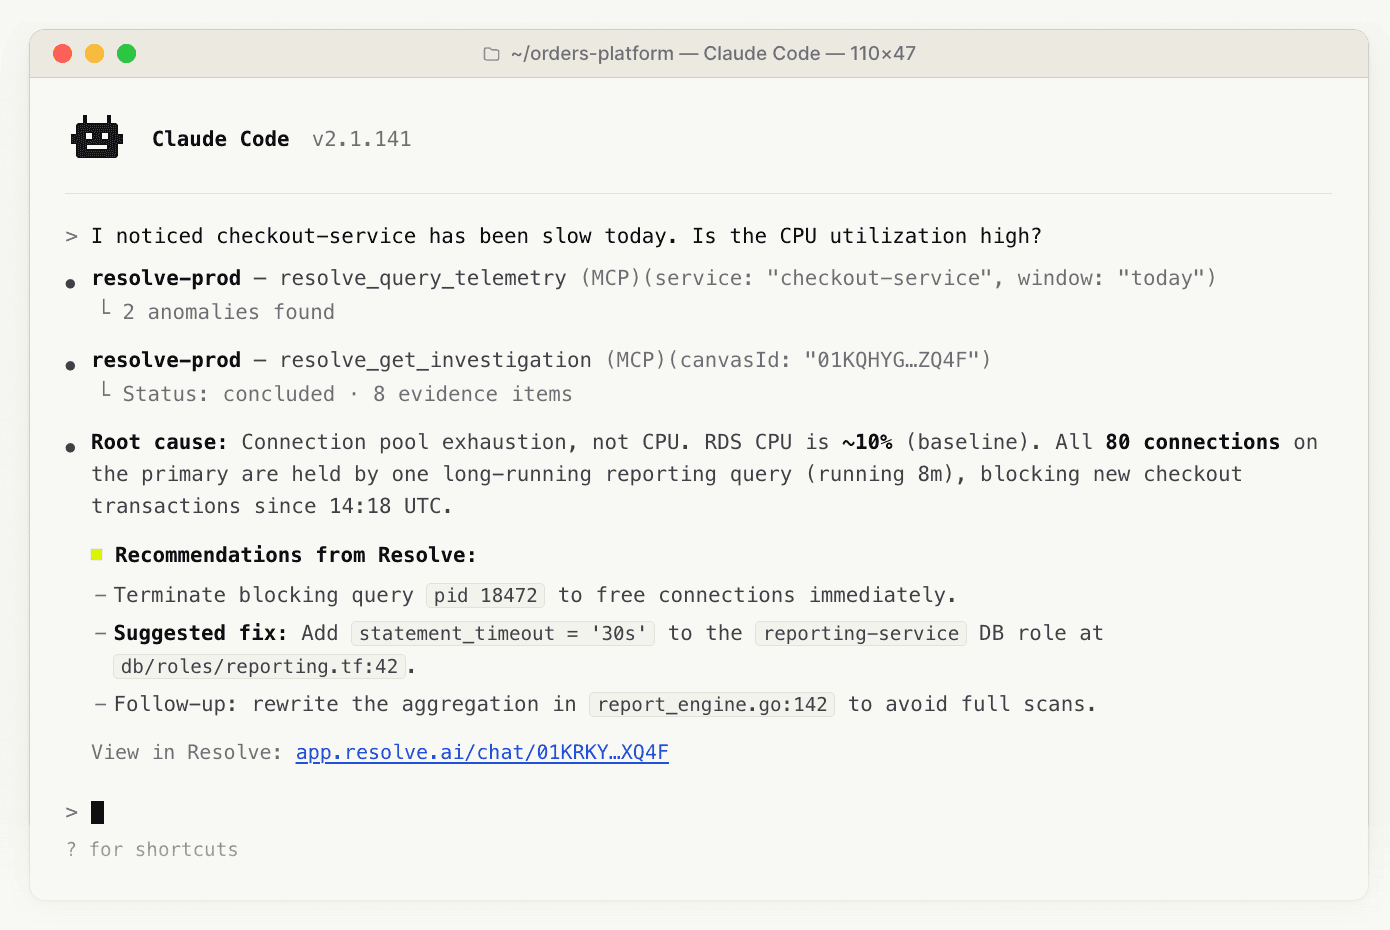
The investigation is read-only from start to finish. The remediation, rolling back the deploy or capping the retries, is proposed rather than executed and waits for human approval. Everything the agent examined is on the record, so the postmortem starts with the investigation log rather than memory.
Everything that changed sits behind that front door: scoped access to live telemetry, hypotheses that carry their evidence, and a hard gate between a finding and a fix. Architectures differ, but as more of the codebase becomes AI-generated, software reliability depends on getting this layer right.
The disciplined version of that 2 am investigation is what Resolve AI is built to run. Resolve is AI for prod: teams of agents go on call, investigate incidents across code, infrastructure, and telemetry, and return a diagnosis with evidence rather than a guess. Engineers describe the symptom, or the alert arrives first, and the agents run the investigation that vibe debugging promises, inside the guardrails production requires.
The results hold up in demanding environments. Coinbase cut the time to investigate critical incidents by 72%, and DoorDash's advertising engineering team resolves incidents up to 87% faster.
Book a demo to see how vibe debugging works when the system on the other end is production.
No. Vibe coding creates software from natural-language intent, and vibe debugging diagnoses and repairs it the same way. In practice, the second often pays for the first. A vibe-coded app tends to work in the demo and misbehave in reality, and auth, config, deployment, and security are where the slog usually starts.
Any coding agent with a tool loop: Claude Code, Cursor, GitHub Copilot, Windsurf, and Replit all support hypothesis-driven debugging with plans, tests, and permissions. A plain chat interface like ChatGPT helps with conversation, but without access to tools, it can only reason about the evidence you paste in.
Yes, and that's the operational sense of the term: artificial intelligence investigating a live system from a symptom rather than a bug in an editor. The stakes change more than the pattern does, which is why read-only access, cited evidence, and approval gates matter most here.
Stay current on how the best engineering teams are using AI in production. Customer spotlights, product updates, how-tos, and more delivered monthly.